Your MICE Data at a glance in your personal Dashboard
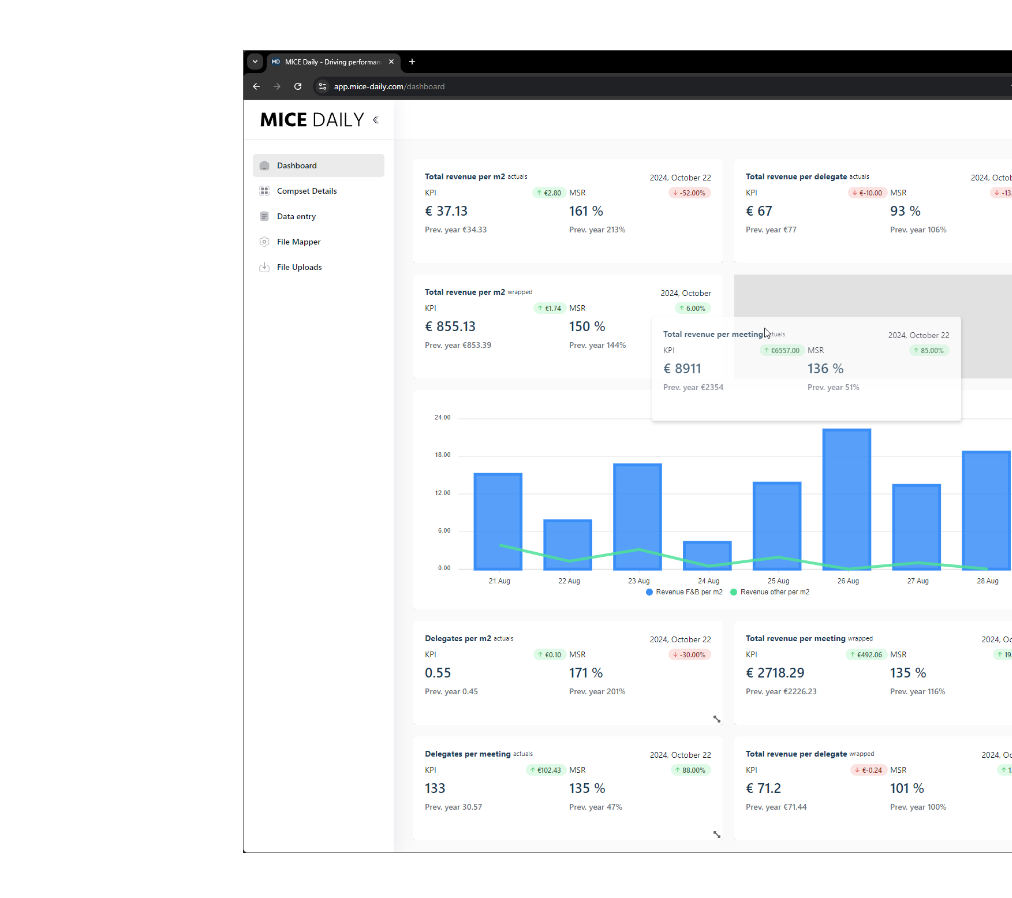
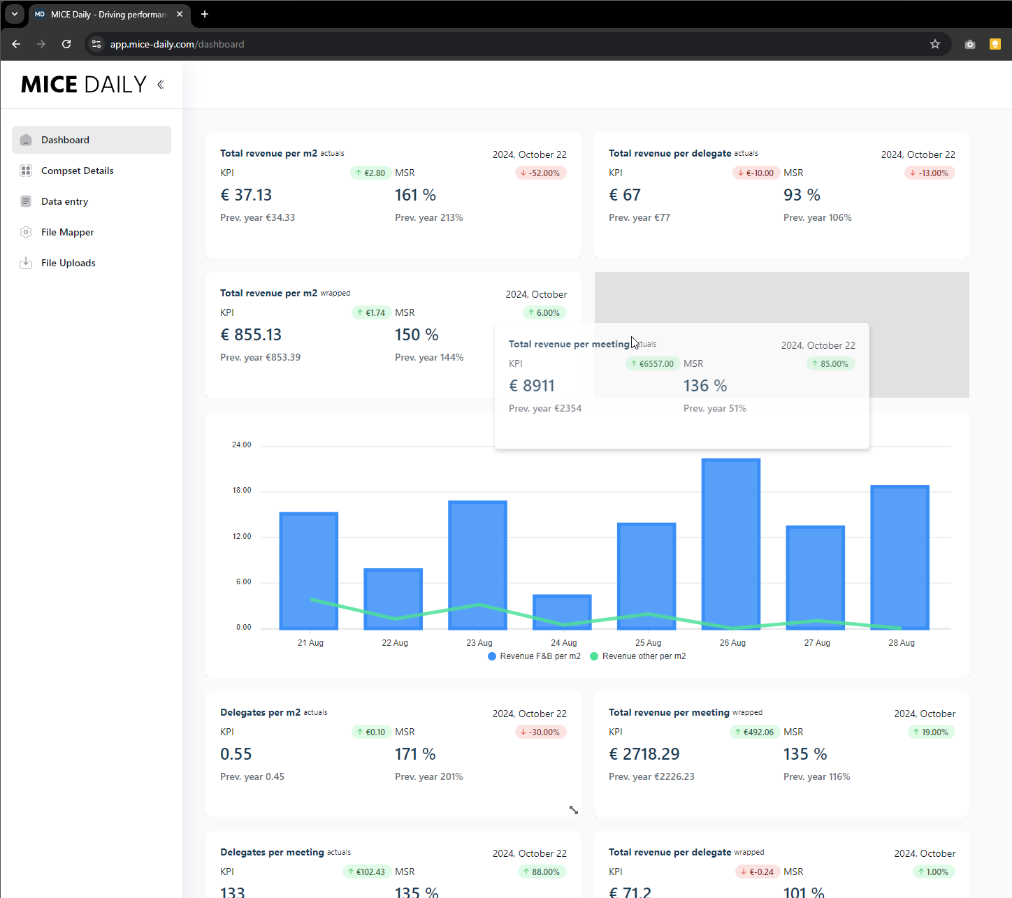
Simply drag and drop your widgets, tables and graphs to where you want them to be, so that you have the market data that matters most to you at a glance. After all, it is your dashboard!

Take a sneak peek at
your dashboard


Design your own dashboard
With our customizable MICE performance dashboard, you decide how to view your data, whether you're a numbers person or prefer a visual approach.
Each login is personalized, allowing you to highlight what matters most at any time. Dive into specific details, such as room rent, F&B, or AV revenue, or explore a particular day's performance. Want to assess your pricing? Focus on revenue per delegate. Curious about space efficiency? Place widgets for delegates per square meter and total revenue per square meter front and center. Tailor the dashboard to your needs, making insights clearer and more actionable.


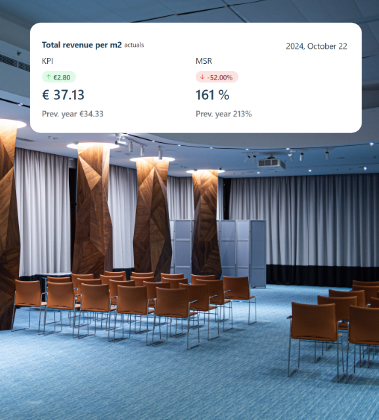
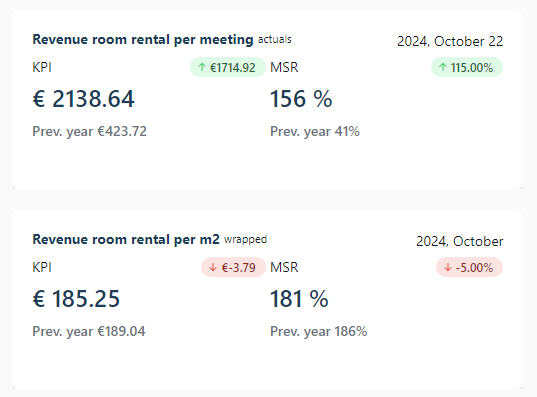
Single value widget
Detailed information about one single KPI. Compare revenue to your competitors, assess your Market Share Ratio and see the difference with last year’s performance for any KPI. Have a closer look at a day, week, month, or year.

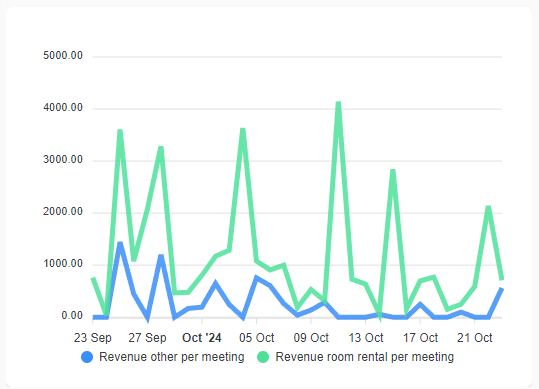
Chartwidget
See at a glance how your KPI has evolved over the last 7, 14 or 30 days compared to last year’s performance.


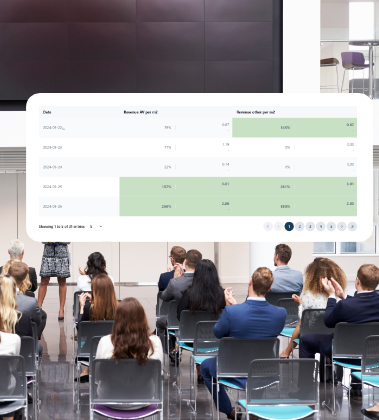
Periodical Overview Table widget
Most detailed widget where you can see trend of a specific KPI over a longer time period. Al the information is there: your KPI, the compset average, your Market Share Ratio, your ranking, yoy comparison.


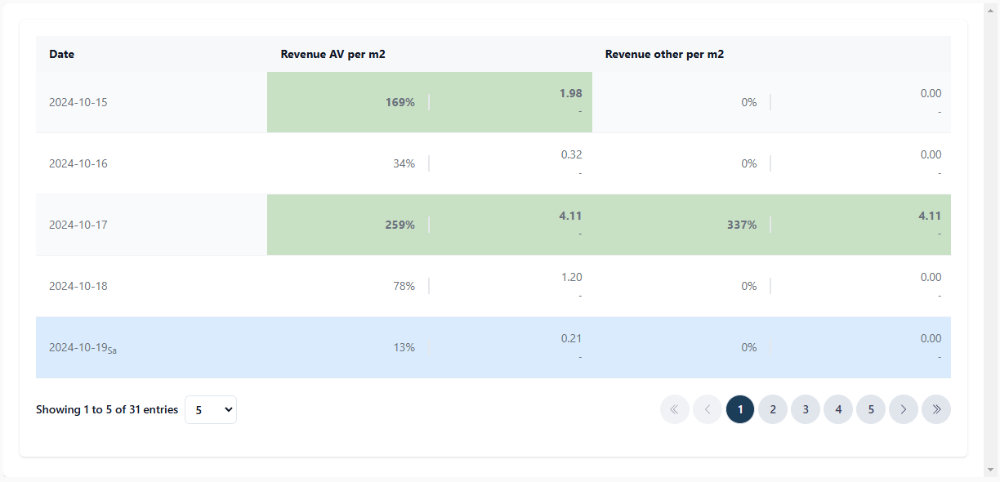
Ranking Table widget
A widget where you can see the ranking of some of you chosen KPI’s for a period of time. Understand the trends in performance compared to your competitor.
